Have you ever been stuck trying to understand your code and logged the contents of a variable?
NSLog(@"%@", whatIsInsideThisThing);
Or skipped a function call to simplify the behavior of the program?
NSNumber *n = @7; // theFunctionThatShouldReallyBeCalled();
Or short-circuited a logical check?
if (1 || theBooleanAtStake) { ... }
Or faked the implementation of a function?
								int calculateTheTrickyValue {
  return 9;

  /*
   Figure this out later.
   ...
}
And had to recompile, and start over each time?
Building software is complicated and bugs will always appear. A common fix cycle is to modify the code, compile, run again, and wish for the best.
It doesn't have to be that way. You can use the debugger! And even if you already know how to inspect values, there is a lot more it is capable of.
This article intends to challenge your knowledge of debugging, explain the basics in a bit more detail than you likely know, and then show you a collection of fun examples. Let's take it for a spin and see where we end up.
LLDB
LLDB is an open-source debugger that features a REPL, along with C++ and Python plugins. It comes bundled inside Xcode and lives in the console at the bottom of the window. A debugger allows you to pause a program at a specific moment of its execution, inspect the values of variables, execute custom instructions, and then manipulate the advancement of the program as you see fit. (Here is one explanation of how debuggers work in general.)
It's likely that you have used a debugger before, even if only in Xcode's UI to add breakpoints. But with a few tricks, there are some pretty cool things that you can do. The GDB to LLDB reference is a great bird's-eye view of the available commands, and you might also want to install Chisel, an open-source collection of LLDB plugins that make debugging even more fun!
In the meantime, let's begin our journey and start with how to print variables in the debugger.
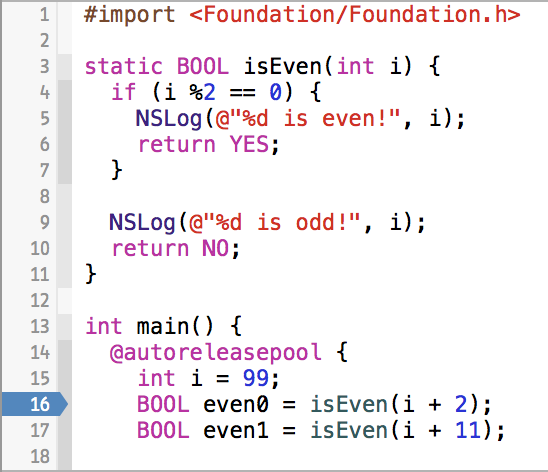
The Basics
Here is a small, simple program that logs a string. Notice that a breakpoint has been added on line 8, which was made by clicking in the gutter in the source view in Xcode:
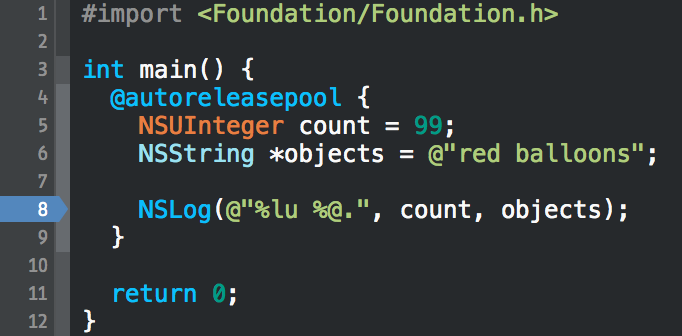
The program will pause its execution at that line and the console will open, allowing us to interact with the debugger. What shall we type?
help
The easiest command to try is help, which will list all the commands. And if you ever forget what a command does or want to know more, then you can read all the details with help <command>, e.g. help print or help thread. If you ever forget what the help command does, then you can try help help, but if you know enough to do that, then maybe you haven't entirely forgotten what the command does after all. 😛
Printing values is easy; just try the print command:
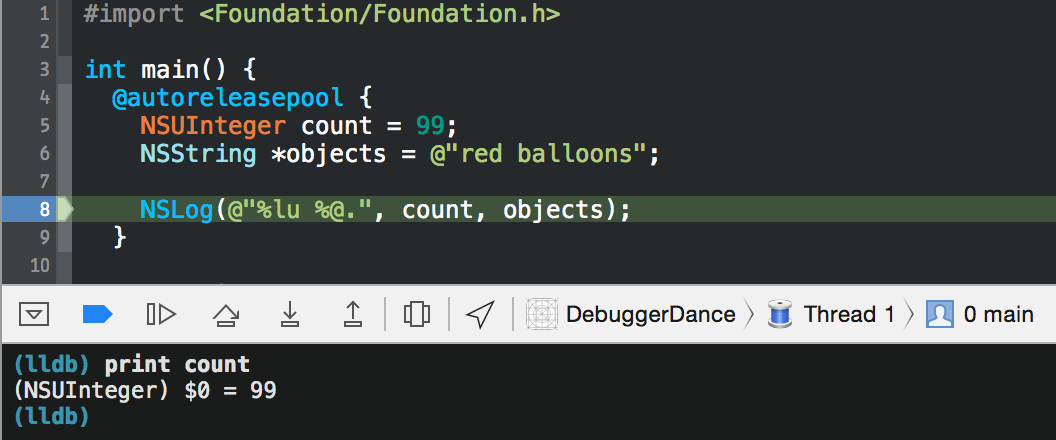
LLDB actually does prefix matching, so you would be fine to try prin, pri, or p. You can't use pr, since LLDB can't disambiguate it from the process command (luckily for us, p has been disambiguated).
You'll also notice that the result has a $0 in it. You can actually use this to reference the result! Try print $0 + 7 and you'll see 106. Anything starting with a dollar sign is in LLDB's namespace and exists to help you.
expression
What if you want to modify a value? Modify, you say? Yes, modify! That's where the handy expression command comes in:
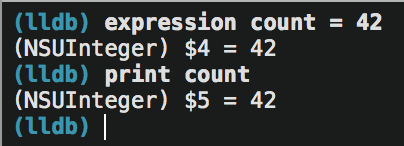
This doesn't just modify the value in the debugger. It actually modifies the value in the program! If you resume the program at this point, it will print 42 red balloons. Magic.
Note that from now on, we will be lazy with the number of characters, and replace print and expression with p and e, respectively.
What is the print Command?
Here's a fun expression to consider: p count = 18. If we execute that command and then print the contents of count, we’ll see that it behaves exactly as if we had run expression count = 18.
The difference is that the print command takes no arguments, unlike the expression command. Consider e -h +17. It is not clear if it means to execute +17 as input, only with the -h flag, or if it intends to compute the difference between 17 and h. It finds that hyphen quite confusing indeed; you may not get the result that you like.
Luckily, the solution is quite simple. Use -- to signify the end of the flags and the beginning of the input. Then if you want the -h flag, you would do e -h -- +17, and if you want the difference, you would do e -- -h +17. Since passing no flags is quite common, there is an alias for e --. It is called print.
If you type help print and scroll all the way down, it will say:
'print' is an abbreviation for 'expression --'.
Printing Objects
If we try
p objects
then the output is a bit verbose:
(NSString *) $7 = 0x0000000104da4040 @"red balloons"
It's even worse if we try to print a more complex structure:
								(lldb) p @[ @"foo", @"bar" ]

(NSArray *) $8 = 0x00007fdb9b71b3e0 @"2 objects"
Really, we want to see the description method of the object. We need to tell the expression command to print the result as an object, using the -O flag (that's an "oh"):
								(lldb) e -O -- $8
<__NSArrayI 0x7fdb9b71b3e0>(
foo,
bar
)
Luckily, e -O -- is aliased as po (for print object), and we can just use that:
								(lldb) po $8
<__NSArrayI 0x7fdb9b71b3e0>(
foo,
bar
)
(lldb) po @"lunar"
lunar
(lldb) p @"lunar"
(NSString *) $13 = 0x00007fdb9d0003b0 @"lunar"
Print Variations
There are many different formats that you can specify for the print command. They are written in the style print/<fmt>, or simply p/<fmt>. Following are some examples.
The default format:
								(lldb) p 16
16
Hexadecimal:
								(lldb) p/x 16
0x10
Binary (the t stands for two):
								(lldb) p/t 16
0b00000000000000000000000000010000
(lldb) p/t (char)16
0b00010000
You can also do p/c for a character, or p/s for a string, as a null-terminated char *. Here is the complete list of formats.
Variables
Now that you can print objects and simple types, and modify them in the debugger with the expression command, let's use some variables to reduce how much typing we need to do. Just as you might declare a variable in C as int a = 0, you can do the same thing in LLDB. However, to be used, the variable must start with a dollar sign:
								(lldb) e int $a = 2
(lldb) p $a * 19
38
(lldb) e NSArray *$array = @[ @"Saturday", @"Sunday", @"Monday" ]
(lldb) p [$array count]
2
(lldb) po [[$array objectAtIndex:0] uppercaseString]
SATURDAY
(lldb) p [[$array objectAtIndex:$a] characterAtIndex:0]
error: no known method '-characterAtIndex:'; cast the message send to the method's return type
error: 1 errors parsing expression
Awww. LLDB couldn't figure out the types involved. This happens at times. Just give it a hint:
								(lldb) p (char)[[$array objectAtIndex:$a] characterAtIndex:0]
'M'
(lldb) p/d (char)[[$array objectAtIndex:$a] characterAtIndex:0]
77
Variables make the debugger much easier to work with. Who would have thunk? 😉
Flow Control
When you insert a breakpoint in the gutter in the source editor in Xcode (or add a breakpoint through one of the means below), the program will come to a stop when it hits the breakpoint.
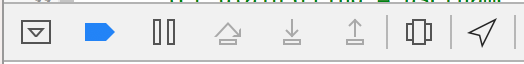
Then there are four buttons in the debug bar that you can use to control the flow of execution of the program:
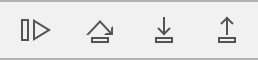
The buttons are, in order from left to right: continue, step over, step into, step out.
The first, continue, will unpause the program and allow it to continue execution normally (perhaps forever, or until it hits another breakpoint). In LLDB, you can execute this command as process continue, which is aliased to continue, and thus, just c.
The second, step over, will execute a line of code as if it were a black box. If the line you are at is a function call, then it will not go inside the function, but instead execute the function and keep going. LLDB makes this available as thread step-over, next, or n.
If you do want to step inside a function call in order to debug or examine its execution, then use the third button, step in, available in LLDB as thread step-in, step, and s. Notice that next and step behave the same when the current line of code is not a function call.
Most people know c, n, and s. But then there is the fourth button, step out. If you ever accidentally step into a function when you meant to step over it, then the typical response is to run n repeatedly until the function returns. Step out is your savior here. It will continue execution until the next return statement (until a stack frame is popped), and then stop again.
Example
Consider this partial program:
Say we run the program, allow it to stop at the breakpoint, and then execute this sequence of commands:
								p i
n
s
p i
finish
p i
frame info
Here, frame info will tell you the current line number and source file, among other things; look at help frame, help thread, and help process for more information. So what will the output be? Think about it before reading the answer!
								(lldb) p i
(int) $0 = 99
(lldb) n
2014-11-22 10:49:26.445 DebuggerDance[60182:4832768] 101 is odd!
(lldb) s
(lldb) p i
(int) $2 = 110
(lldb) finish
2014-11-22 10:49:35.978 DebuggerDance[60182:4832768] 110 is even!
(lldb) p i
(int) $4 = 99
(lldb) frame info
frame #0: 0x000000010a53bcd4 DebuggerDance`main + 68 at main.m:17
The reason that it is still on line 17 is because the finish command ran until the return of the isEven() function, and then stopped immediately. Note that even though it is on line 17, it has already executed the line!
Thread Return
There is one more awesome function that you can use to control program flow when debugging: thread return. It takes an optional argument, loads that into the return register, and immediately executes the return command, jumping out of the current stack frame. This means that the rest of the function is not executed. This could cause problems with ARC's reference counting/tracking, or prevent any cleanup you have inside a function. However, executing this command right at the start of a function is a great way to "stub" the function and fake it returning another value.
Let's run a sightly modified set of commands with the same snippet of code above:
								p i
s
thread return NO
n
p even0
frame info
Think about it before you read the answer. OK, here's the answer:
								(lldb) p i
(int) $0 = 99
(lldb) s
(lldb) thread return NO
(lldb) n
(lldb) p even0
(BOOL) $2 = NO
(lldb) frame info
frame #0: 0x00000001009a5cc4 DebuggerDance`main + 52 at main.m:17
Breakpoints
We have all used breakpoints as a way to bring a program to a stop, inspect the current state, and hunt down bugs. But if we change our interpretation of breakpoints, a lot more becomes possible.
A breakpoint allows you to instruct a program when to stop, and then allows the running of commands.
Consider putting a breakpoint at the start of a function, using thread return to override the behavior of the function, and then continuing. Now imagine automating this process. Sounds yummy, doesn't it?
Managing Breakpoints
Xcode offers a bunch of tools for creating and manipulating breakpoints. We'll go through each and describe the equivalent commands in LLDB that would create the same breakpoint (yes, you can add breakpoints from inside the debugger).
In the left pane in Xcode, there is a collection of buttons. One looks like a breakpoint. Clicking it opens the breakpoint navigator, a pane where you can manipulate all of your breakpoints at a glance:
Here you can see all of your breakpoints — breakpoint list (or br li) in LLDB. You can also click on an individual breakpoint to turn it on or off — breakpoint enable <breakpointID> and breakpoint disable <breakpointID> in LLDB:
								(lldb) br li
Current breakpoints:
1: file = '/Users/arig/Desktop/DebuggerDance/DebuggerDance/main.m', line = 16, locations = 1, resolved = 1, hit count = 1

  1.1: where = DebuggerDance`main + 27 at main.m:16, address = 0x000000010a3f6cab, resolved, hit count = 1

(lldb) br dis 1
1 breakpoints disabled.
(lldb) br li
Current breakpoints:
1: file = '/Users/arig/Desktop/DebuggerDance/DebuggerDance/main.m', line = 16, locations = 1 Options: disabled

  1.1: where = DebuggerDance`main + 27 at main.m:16, address = 0x000000010a3f6cab, unresolved, hit count = 1

(lldb) br del 1
1 breakpoints deleted; 0 breakpoint locations disabled.
(lldb) br li
No breakpoints currently set.
Creating Breakpoints
In the example we have been using, we clicked on "16" in the gutter in the source view to create a breakpoint. To remove it, you can drag the breakpoint out of the gutter and let go of the mouse (it will vanish with a cute poof animation). You can also select a breakpoint in the breakpoint navigator and then press the delete key to remove it.
To create a breakpoint in the debugger, use the breakpoint set command:
								(lldb) breakpoint set -f main.m -l 16
Breakpoint 1: where = DebuggerDance`main + 27 at main.m:16, address = 0x000000010a3f6cab
The shortest abbreviation you can use is br. As it turns out, b is an entirely different command (an alias for _regexp-break), but it is robust enough to allow the same breakpoint as above:
								(lldb) b main.m:17
Breakpoint 2: where = DebuggerDance`main + 52 at main.m:17, address = 0x000000010a3f6cc4
You can also put a breakpoint on a symbol (a C function), without having to specify the line number:
								(lldb) b isEven
Breakpoint 3: where = DebuggerDance`isEven + 16 at main.m:4, address = 0x000000010a3f6d00
(lldb) br s -F isEven
Breakpoint 4: where = DebuggerDance`isEven + 16 at main.m:4, address = 0x000000010a3f6d00
These breakpoints will now stop exactly at the start of the function, and this works for Objective-C methods too:
								(lldb) breakpoint set -F "-[NSArray objectAtIndex:]"
Breakpoint 5: where = CoreFoundation`-[NSArray objectAtIndex:], address = 0x000000010ac7a950
(lldb) b -[NSArray objectAtIndex:]
Breakpoint 6: where = CoreFoundation`-[NSArray objectAtIndex:], address = 0x000000010ac7a950
(lldb) breakpoint set -F "+[NSSet setWithObject:]"
Breakpoint 7: where = CoreFoundation`+[NSSet setWithObject:], address = 0x000000010abd3820
(lldb) b +[NSSet setWithObject:]
Breakpoint 8: where = CoreFoundation`+[NSSet setWithObject:], address = 0x000000010abd3820
If you want to create a symbolic breakpoint in Xcode's UI, then click the + button at the bottom left of the breakpoint navigator:
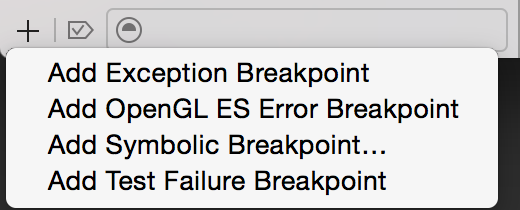
Then choose the third option:
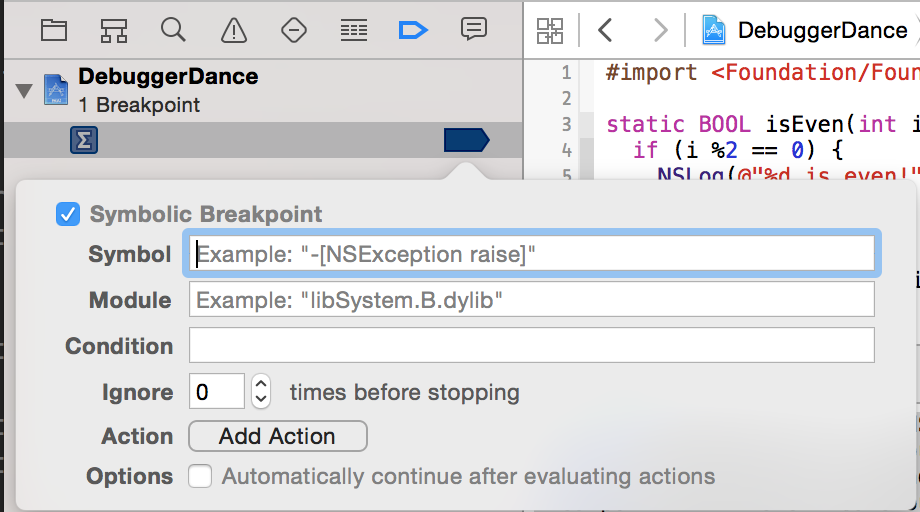
A popover will appear where you can enter in a symbol such as -[NSArray objectAtIndex:], and then the breakpoint will cause the program to stop any time that method is called, whether from your code or Apple's!
If we look at the other options, we can see that there are some enticing options, which are also available for any breakpoint if you right click it in Xcode's UI and select the "Edit Breakpoint" option:
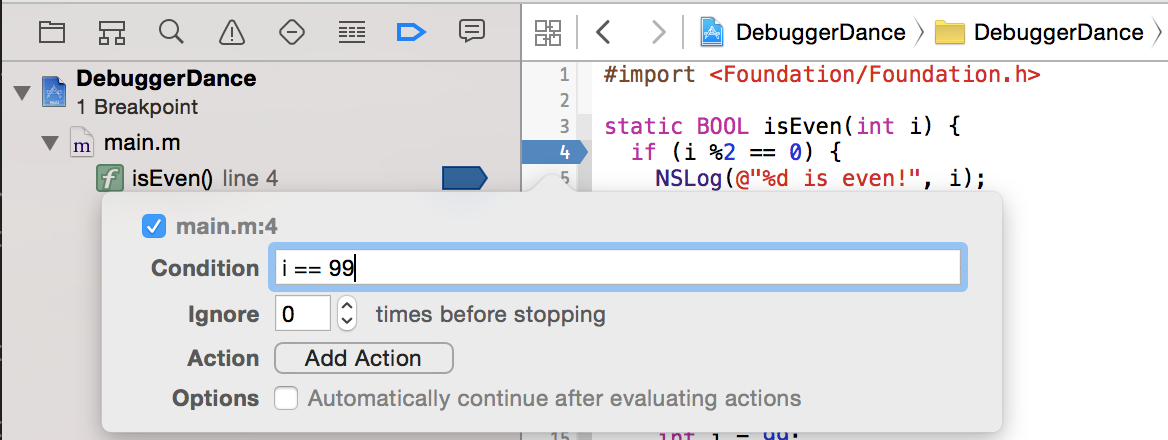
Here, the breakpoint has been modified to only stop when i is 99. You can also use the "ignore" option to tell the breakpoint to not stop the first n times it is called (and the condition is true).
And then there is that "Add Action" button...
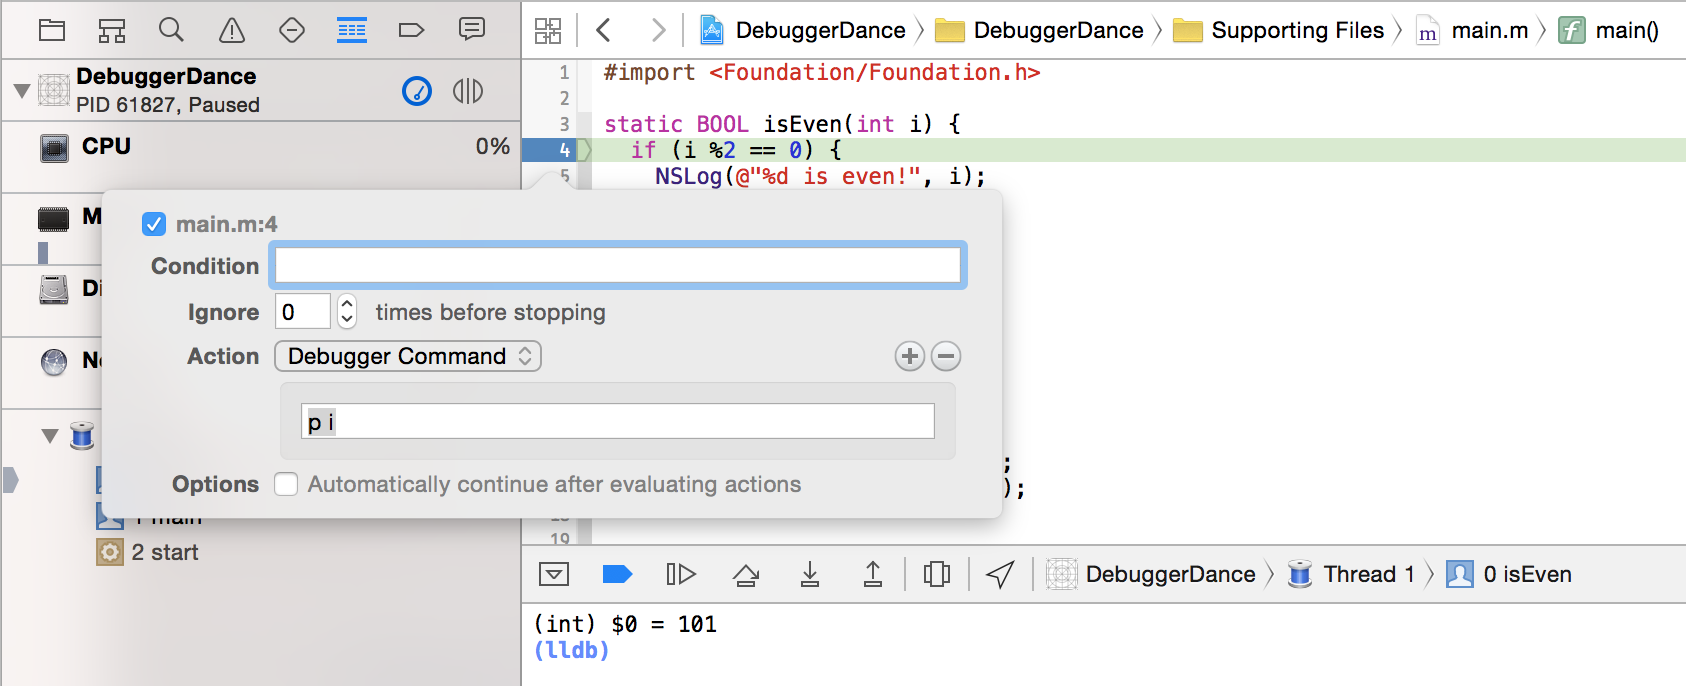
Breakpoint Actions
Perhaps in the example breakpoint above, you want to know the value of i every time the breakpoint is hit. We can use the action p i, and then when the breakpoint is hit and we enter the debugger, it will execute that command before giving you control:
You can also add multiple actions, which can be debugger commands, shell commands, or more robust printing:
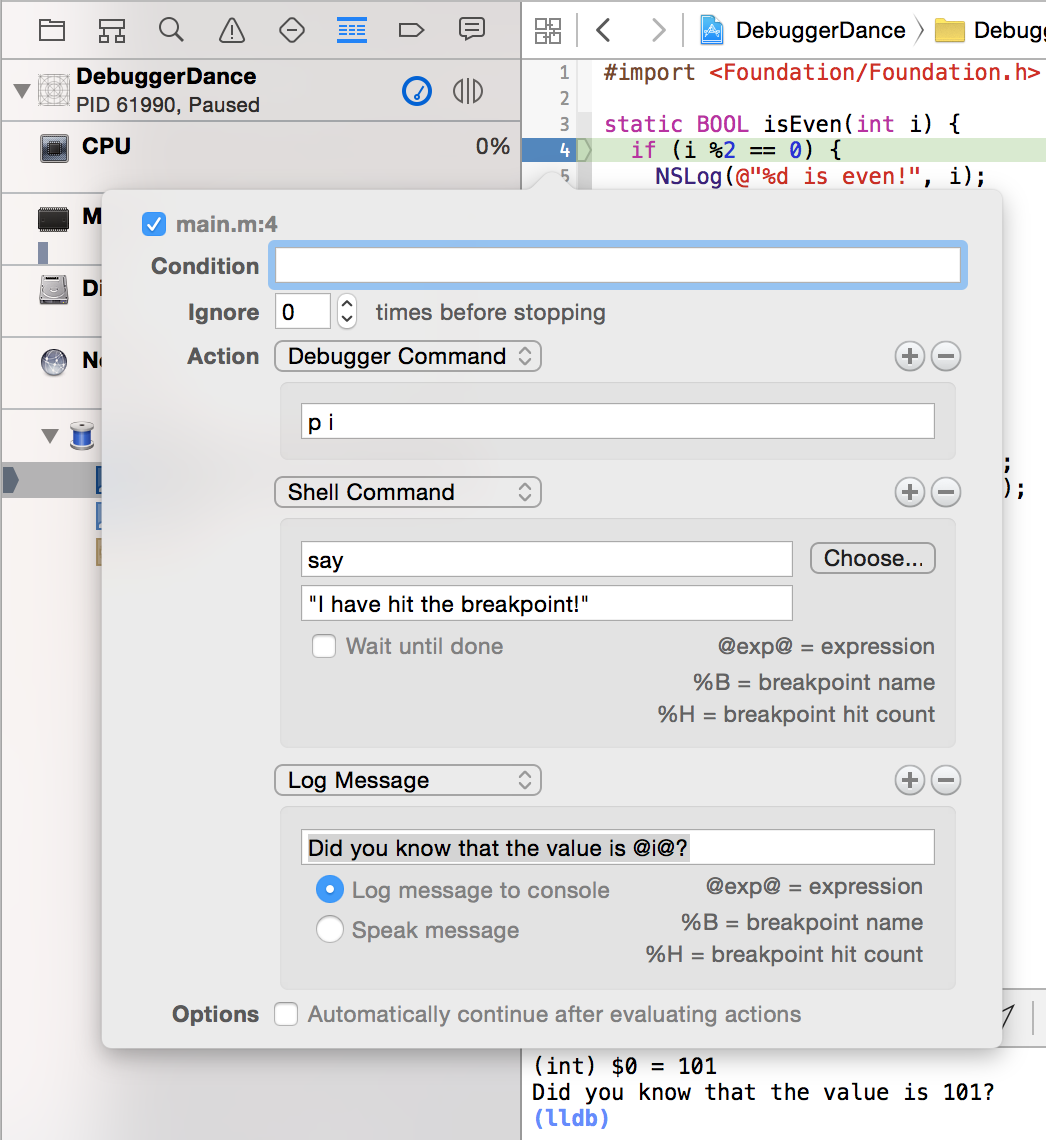
You can see that it printed i, then it said that sentence aloud (!), and then printed the custom expression.
Here's what some of this looks like when done in LLDB instead of Xcode's UI:
								(lldb) breakpoint set -F isEven
Breakpoint 1: where = DebuggerDance`isEven + 16 at main.m:4, address = 0x00000001083b5d00
(lldb) breakpoint modify -c 'i == 99' 1
(lldb) breakpoint command add 1
Enter your debugger command(s).  Type 'DONE' to end.
> p i
> DONE
(lldb) br li 1
1: name = 'isEven', locations = 1, resolved = 1, hit count = 0
    Breakpoint commands:
      p i

Condition: i == 99

  1.1: where = DebuggerDance`isEven + 16 at main.m:4, address = 0x00000001083b5d00, resolved, hit count = 0
Automation, here we come!
Continuing after Evaluation
If you look at the bottom of the edit breakpoint popover, you'll see one more option: "Automatically continue after evaluation actions." It's just a checkbox, but it holds immense power. If you check it, the debugger will evaluate all of your commands and then continue running the program. It won't even be apparent that it executed the breakpoint at all (unless the breakpoint fires a lot and your commands take a while, in which case, your program will slow down).
This checkbox is the same as having the last breakpoint action be continue, but having a checkbox just makes it easier. And here it is in the debugger:
								(lldb) breakpoint set -F isEven
Breakpoint 1: where = DebuggerDance`isEven + 16 at main.m:4, address = 0x00000001083b5d00
(lldb) breakpoint command add 1
Enter your debugger command(s).  Type 'DONE' to end.
> continue
> DONE
(lldb) br li 1
1: name = 'isEven', locations = 1, resolved = 1, hit count = 0
    Breakpoint commands:
      continue

  1.1: where = DebuggerDance`isEven + 16 at main.m:4, address = 0x00000001083b5d00, resolved, hit count = 0
Automatically continuing after evaluating a breakpoint allows you to modify your program solely through the use of breakpoints! You could stop at a line, run an expression command to change a variable, and then continue.
Examples
Consider the infamous "print-debug" technique. Instead of
NSLog(@"%@", whatIsInsideThisThing);
replace this log statement with a breakpoint that prints the variable and then continues.
Instead of
								int calculateTheTrickyValue {
  return 9;

  /*
   Figure this out later.
   ...
}
add a breakpoint that uses thread return 9 and then have it continue.
Symbolic breakpoints with actions are really powerful. You can also add them to your friends' Xcode projects and have actions that speak things aloud. See how long it takes them to figure out what is going on. 😄
Full Execution in the Debugger
There is one more idea to look at before we start dancing. You really can run just about any C/Objective-C/C++/Swift command in the debugger. The one weak spot is that it cannot create new functions... which means no new classes, blocks, functions, C++ classes with virtual methods, etc. Other than that, it can do it all!
We can malloc some bytes:
								(lldb) e char *$str = (char *)malloc(8)
(lldb) e (void)strcpy($str, "munkeys")
(lldb) e $str[1] = 'o'
(char) $0 = 'o'
(lldb) p $str
(char *) $str = 0x00007fd04a900040 "monkeys"
Or we can inspect some memory (using the x command) to see 4 bytes of our new array:
								(lldb) x/4c $str
0x7fd04a900040: monk
We can also look 3 bytes down (the x command requires backticks, since it only takes a memory address and not actually an expression; see help x for more information):
								(lldb) x/1w `$str + 3`
0x7fd04a900043: keys
But when you are all done, be sure to free the memory so that you don't leak (lol... we are in the debugger):
(lldb) e (void)free($str)
Let's Dance
Now that we know the basic steps, it's time to dance and do some crazy things. I once wrote a blog post on looking at the internals of NSArray. The post uses a lot of NSLog statements, but I actually did all the exploration in the debugger. It may be a fun exercise to see if you can figure out how.
Poking around without a Breakpoint
When an application is running, the debug bar in Xcode's UI shows a pause button instead of a continue one:
Clicking that button will pause the app (it runs process interrupt, since LLDB is always attached behind the scenes). This will then give you access to the debugger, but it might not look like you can do much, since there are no variables in scope, and there is no specific area of the code to look at.
That's where things get fun. If you are running an iOS app, you could try this (since globals are available)
								(lldb) po [[[UIApplication sharedApplication] keyWindow] recursiveDescription]
<UIWindow: 0x7f82b1fa8140; frame = (0 0; 320 568); gestureRecognizers = <NSArray: 0x7f82b1fa92d0>; layer = <UIWindowLayer: 0x7f82b1fa8400>>
   | <UIView: 0x7f82b1d01fd0; frame = (0 0; 320 568); autoresize = W+H; layer = <CALayer: 0x7f82b1e2e0a0>>
and see the entire hierarchy! Chisel implements this as pviews.
Updating the UI
Then, given the above output, we could stash the view:
(lldb) e id $myView = (id)0x7f82b1d01fd0
Then modify it in the debugger to change its background color:
(lldb) e (void)[$myView setBackgroundColor:[UIColor blueColor]]
However, you won't see any changes until you continue the program again. This is because the changes need to be sent over to the render server and then the display will be updated.
The render server is actually another process (called backboardd), and even though the containing process of what we are debugging is interrupted, backboardd is not!
This means that without continuing, you can execute the following:
(lldb) e (void)[CATransaction flush]
The UI will update live in the simulator or on the device while you are still in the debugger! Chisel provides an alias for this called caflush, and it is used to implement other shortcuts like hide <view>, show <view>, and many, many others. All of Chisel's commands have documentation, so feel free to run help show after installing it to see more information.
Pushing a View Controller
Imagine a simple application with a UINavigationController at the root. You could get it pretty easily in the debugger by executing the following:
(lldb) e id $nvc = [[[UIApplication sharedApplication] keyWindow] rootViewController]
Then push a child view controller:
								(lldb) e id $vc = [UIViewController new]
(lldb) e (void)[[$vc view] setBackgroundColor:[UIColor yellowColor]]
(lldb) e (void)[$vc setTitle:@"Yay!"]
(lldb) e (void)[$nvc pushViewContoller:$vc animated:YES]
Finally, execute the following:
(lldb) caflush // e (void)[CATransaction flush]
You will see the navigation controller pushed right before your very eyes!
Finding the Target of a Button
Imagine you have a variable in the debugger, $myButton, that you got from creating it, grabbing it from the UI, or simply having it as a variable in scope when you are stopped at a breakpoint. You might wonder who receives the actions when you tap on it. Here's how easy it is:
								(lldb) po [$myButton allTargets]
{(
    <MagicEventListener: 0x7fb58bd2e240>
)}
(lldb) po [$myButton actionsForTarget:(id)0x7fb58bd2e240 forControlEvent:0]
<__NSArrayM 0x7fb58bd2aa40>(
_handleTap:
)
Now you might want to add a breakpoint for when that happens. Just set a symbolic breakpoint on -[MagicEventListener _handleTap:], in LLDB or Xcode, and you are all set to go!
Observing an Instance Variable Changing
Imagine a hypothetical case where you have a UIView that was somehow having its _layer instance variable being overwritten (uh oh!). Since there might not be a method involved, we can't use a symbolic breakpoint. Instead, we want to watch when an address is written to.
First we would need to find out where in the object the "_layer" ivar is:
								(lldb) p (ptrdiff_t)ivar_getOffset((struct Ivar *)class_getInstanceVariable([MyView class], "_layer"))
(ptrdiff_t) $0 = 8
Now we know that ($myView + 8) is the memory address being written to:
								(lldb) watchpoint set expression -- (int *)$myView + 8
Watchpoint created: Watchpoint 3: addr = 0x7fa554231340 size = 8 state = enabled type = w
    new value: 0x0000000000000000
This was added to Chisel as wivar $myView _layer.
Symbolic Breakpoints on Non-Overridden Methods
Imagine that you want to know when -[MyViewController viewDidAppear:] is called. What would happen if MyViewController didn't actually implement that method, but its superclass did? We can try setting a breakpoint and see:
								(lldb) b -[MyViewController viewDidAppear:]
Breakpoint 1: no locations (pending).
WARNING:  Unable to resolve breakpoint to any actual locations.
Since LLDB is looking for a symbol, it won't find it, and your breakpoint will never fire. What you need to do is set a condition, [self isKindOfClass:[MyViewController class]], and then put the breakpoint on UIViewController. Normally, setting a condition like this will work, however, here it doesn’t since we don’t own the implementation of the superclass.
viewDidAppear: is a method that Apple wrote, and thus, there are no symbols for it; there is no self when inside that method. If you wanted to use self in a symbolic breakpoint, you would have to know where it is (it could be in the registers or on the stack; in x86 you’ll find it at $esp+4). This is a pain though, because there are already at least four architectures you’d have to know (x86, x86-64, armv7, armv64). Oof! You can imagine taking the time to learn the instruction set and calling convention for each one, and then writing a command that will set a breakpoint for you on the correct super class and with the correct condition. Luckily, this has already been done in Chisel, and is called bmessage:
								(lldb) bmessage -[MyViewController viewDidAppear:]
Setting a breakpoint at -[UIViewController viewDidAppear:] with condition (void*)object_getClass((id)$rdi) == 0x000000010e2f4d28
Breakpoint 1: where = UIKit`-[UIViewController viewDidAppear:], address = 0x000000010e11533c
LLDB and Python
LLDB has full, built-in Python support. If you type script in LLDB, it will open a Python REPL. You can also pass a line of Python to the script command and have it executed without entering the REPL:
								(lldb) script import os
(lldb) script os.system("open http://www.objc.io/")
This allows you to create all sorts of cool commands. Put this in a file, ~/myCommands.py:
								def caflushCommand(debugger, command, result, internal_dict):
  debugger.HandleCommand("e (void)[CATransaction flush]")
Then, in LLDB, run the following:
command script import ~/myCommands.py
Or, put the line in /.lldbinit to have it executed every time LLDB starts. Chisel is nothing more than a collection of Python scripts that concatenate strings, and then tells LLDB to execute them. Simple, huh?
Wield the Debugger
There is a lot that LLDB is capable of. Most of us are used to p, po, n, s, and c, but there is so much more it can do. Mastering all of its commands (there really are not that many) will give you so much more power in unraveling the runtime behavior of your code, finding bugs, forcing specific execution paths, and even prototyping simple interacts — what would happen if a modal view controller opened right now? Try it!
This article was meant to show you a glimpse of the full power that it has and encourage you to be a bit more adventurous with what you type into the console.
Open up LLDB, type help, and see the list of all of the commands. How many have you tried? How many do you use?
Hopefully NSLog doesn't really seem that cool any more. At least it had a run for a while.
Happy debugging!